Customer loyalty
How to Measure Customer Loyalty
15 November 2023 • 5 min read

How can measuring customer loyalty help you deliver an innovative customer experience?
The ability to innovate for customers is a common and important feature of digitally great organisations. Yet meeting customer expectations can often feel as much of an art as it is a science. Striking the balance between the two can be difficult, but there can be big benefits for the organisations that get it right.
To improve the loyalty of their customers, companies must first establish a clear definition of customer loyalty and have a clear way of measuring it. From this baseline, they can make the sort of impacts on customers that encourage them to change behaviours.
At its highest level, customer loyalty is defined as "the positive relationship between the customer and the business, leading to repeat business and the positive perception of the brand by the customer."
Loyalty can be measured in two ways:
1. Behavioural loyalty - This means the actual loyalty as measured by consumers’ recorded behaviour and interactions with the brand.
2. Attitudinal loyalty - This means the loyalty customers feel towards the company, which relates to perception and awareness of the brand.
Behavioural loyalty is a mostly quantitative measure and it’s fairly easy to collect data to support it. Attitudinal loyalty is qualitative and much harder to measure.
Behavioural Loyalty
The most important measurements are:
1. Frequency of ‘actions of interest’: For an online retailer this could be the frequency of customer purchases, but for a publisher this might mean how many articles a person reads in a set amount of time.
Key metrics include: Retention rate, frequency of visits, page depth, length of time on site
2. Total spend: For online retailers this usually means the total spent in a single transaction or total (lifetime) spend so far with the brand. For a publisher or subscription service, this is more likely to be the value of the annual/monthly subscription, or money made from advertising per page or per article.
Key metrics include: Average order value, revenue per user, margin per user, revenue per product
3. Product/content range: This measure explores how many different product or service types a customer bought or used. This could mean the different brands or product types purchased, the blend of content viewed, or the package of services selected in their subscription.
Key metrics include: Conversion rate (by brand, content or product range), items per basket, range of brands/products purchases
How can you use this data to build up a picture of your customers?
In monitoring these metrics, you can start to build a picture of the customers who regularly or frequently visit or interact with your brand, compared with one-off visitors or purchasers about whom you know relatively little.
Armed with this information, you can start to make predictions about how frequently different products will be purchased each year, and then tailor your advertising to make it as relevant as possible (that is, right product at the right time) to your customers.
As an example: imagine you run a website where you sell and create personalised gifts and products. Some items like mug or fridge magnets are low value purchases (~£5-£10). They are easy to create, and might be purchased several times a year by the same customer. A retention rate of ~3-4 products per customer per year is reasonable for this product. On the flipside, a high-value item like a photobook or curated photo collection may take days, weeks or even months to create. It may also be a high value purchase (>£100) and would therefore be purchased less frequently. A retention rate of ~1 purchase per customer per year might be realistic in this case.
By collecting key metrics as identified above, your marketing team can now make their product offers not just more relevant, but also timelier by predicting when the customer might be ready to purchase again.
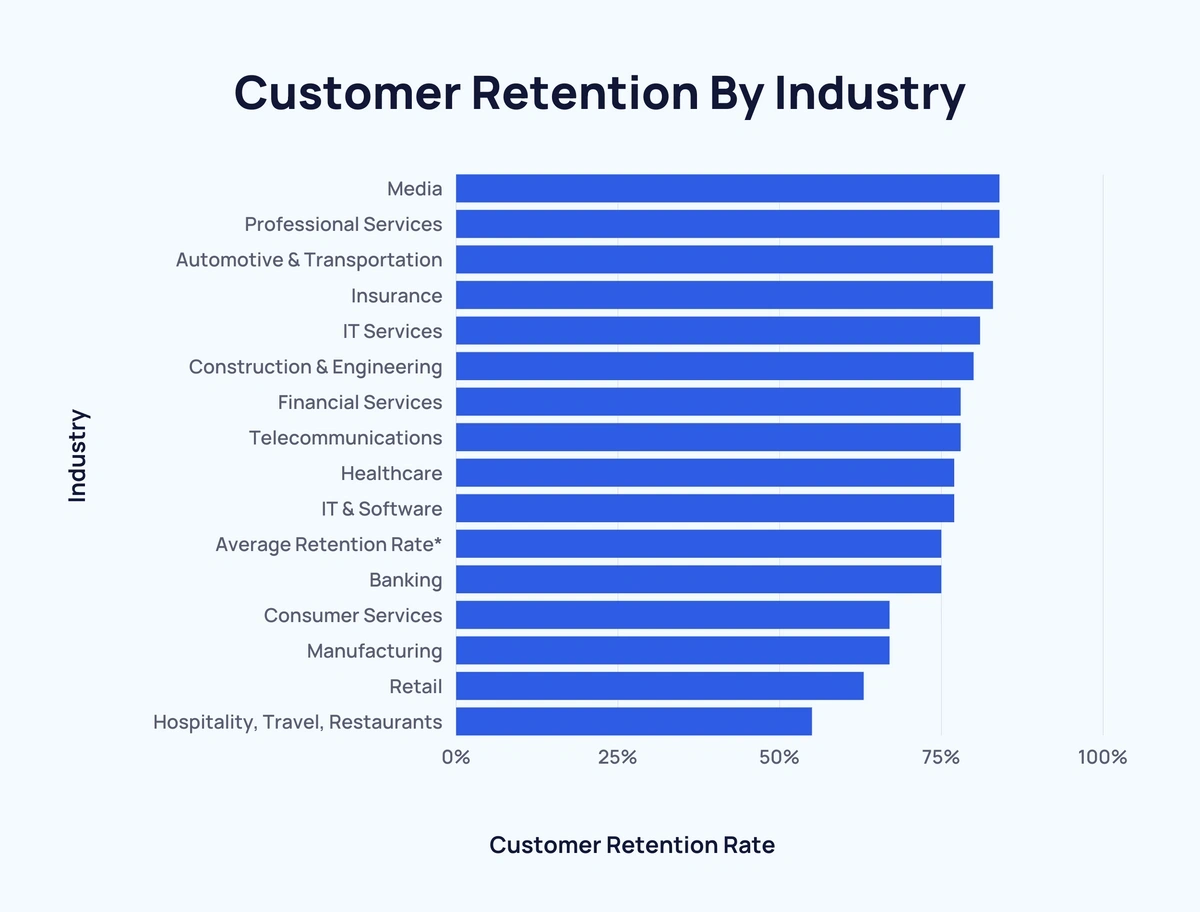
What are typical customer retention rates by industry?
Retention rate is a strong indicator that customers do return and want to return to your store, business or website regularly. However, this can vary a great deal from one industry to another, and it will change over time too: the 8 week retention rate will be very different to the annual rate at which customers return to your store or website. Based on a report from Exploding Topics, typical retention rates by industry are shown below:

Join us on 21 November for our next Digital Greatness webinar - The Catch 22 of Corporate Innovation: Drive new horizons, just don't get it wrong
Attitudinal Loyalty
Attitudinal loyalty is much harder to capture, partially because it is a much more subjective measure based on asking customers to ‘self-score’ their perception of your brand. Yet there is also an inherent selection bias in the data collected: only customers who respond to your survey or customer research will provide data, meaning large amounts of information could be missing.
The most important measurements are:
1. How do customers feel about the company/brand? Could be scored from 1-5 or 1-10, for example.
2. How satisfied do they feel with your product or service? Again this will most likely be a score from 1-5 (or 1-10).
3. How likely are they to recommend your company, brand or product? This is typically referred to as Net Promoter Score, the likelihood that a customer will refer their experience to someone else.
4. How likely are they to switch to another brand or company? You might consider this a loaded or dangerous question, but it is particularly important for companies offering a subscription service to understand the likelihood of a customer going to a competitor.
How can you use attitudinal loyalty data?
Customers who are happy with the brands they use have been shown to be 33% more likely to refer others to those brands — both actively through referral programmes and passively by word of mouth — than users who have a similar level of behavioural loyalty.
These users are more likely to provide feedback (when they are happy and unhappy with your services) and can often form your core user group who visit the most frequently. They are therefore the most likely to notice changes and improvements over a long period of time, but they are also most likely to complain about changes they do not like.
Product and marketing teams can tap into this resource to understand customer needs more deeply, improve the proposition offered to customers and make use of the positive perception of their brand in order to acquire new customers. In the next article in this series, we’ll take a look at how you can experiment in order to improve customer loyalty and what impact this can have on customer behaviour.
Join us on 21 November for our next Digital Greatness webinar - The Catch 22 of Corporate Innovation: Drive new horizons, just don't get it wrong

.png?width=564&height=348&name=Screenshot%202025-06-10%20at%2015.03.23%20(4).png)

