.png?width=1920&height=836&name=The%20trouble%20with%20Gantt%20charts%20(1).png)

I have a secret: I hate Gantt Charts.
I hate the way they look. I hate the way people interact with them. I hate the time it takes to build one. I hate the way it encourages people to behave.
Think back to the last Gantt chart you saw. It probably looked like a sprawl of boxes where your “resources” were happily delivering packages of work to set schedules.
Gantt charts are fixed. That gives them a veneer of reliability and objectivity. That’s why organisations often drop screenshots of a chart into multiple slide decks which are then handed round the organisation as evidence of operational excellence. (This evidence is flimsy at best, but it might occasionally dupe senior management.)
While life shifts around a Gantt chart, the charts are usually fixed in place. They are framed and held aloft until the project is well and truly off target. Only then will project managers scramble and cut the scope of the “less important” final stages of the project which is almost always quality assurance.
Gantt charts and flimsy deadlines
The problem with Gantt charts is that they seem to articulate a worldview that is clear, ordered and precise. They make managers think they can influence time. They make you think that decision making around sequencing and moving work between teams is as simple as a swipe across a spreadsheet or a drag across a grid. We need this to happen earlier, someone says. Easy: let’s just drag it or squeeze the date a little.
But here’s the fundamental problem. Work never starts on time, it doesn’t occupy full days of effort and it rarely gracefully completes on schedule with no repercussions. Work morphs and flexes. Things are discovered. People go on holiday. Communication breaks down. This has implications on the plan and causes projects to slip away, missing deadlines. To quote Douglas Adams: “I love deadlines. I love the whooshing sound they make as they fly by.”
What is a deadline? The term itself is thought by some to come from the US Civil War, referring to a visual boundary around a prison. If a prisoner crossed it, they would be shot on site. We put these in our projects to indicate the same idea - whether the punishment for crossing your deadline is the same as that in the Civil War will largely depend on where you work.
And yet it’s rarely such a clean death. Instead the project sponsor withdraws funding and asks for frequent updates, slowly starving the team of its resources until it either limps over the delivery line or dies trying at a much later date than anticipated.
Phony milestones
Another concept we find in Gantt Charts is the milestone. Milestones are intended to be indicators of progress, but more than often than not they are really just linked to things that should complete by a given date simply to show that things are on track.
And therein lies the problem: a milestone isn’t a measure of time - they’re just dates - measures of distance.
In Gantt charts milestones are really just moments in time - usually moments when you enter a meeting with a stakeholder to apologise for the late delivery, promising that the next quarter will, for some reason, be better (because all the hard stuff is done, apparently).
Read next: How Agile teams can better manage requirements: 3 key questions to answer
Gantt charts encourage us to idealise the future
The problem is the future always looks ideal. All the best things happen out there. There’s no obstacles.
In the future, things always go to plan. We drag two isolated items on the chart together, believing we can work on them in tandem. The past, however, is difficult. The past is messy, broken, chaotic - things didn’t happen, people were absent or maybe left the project. The past is marked by interruptions; the real world kept getting in the way.
But let’s get specific about the physical layout of the Gantt Chart. When you take away columns, rows, labels and the grid - only 8% of the average gantt chart is used to actually tell a story.
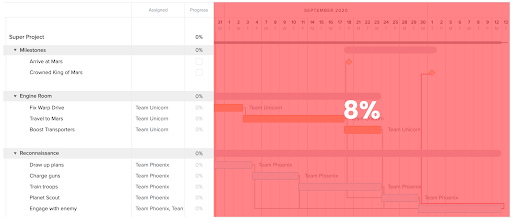
As the great Edward Tufte once said: “for these charts, the main visual statement is the administrative grid prison, not the actual tasks contained by the grid.”
Gantt charts encourage the wrong behaviours
But let me get to my main concern around Gantt Charts: the behaviours it stimulates in leadership teams. It's wrong to think that Gantt charts are simply marred by bad practice. In fact, the problem is that the way they look and the way we interact with them necessarily encourages bad practice. Even if you have the best of intentions, a Gantt chart will try its best to undermine you.
I’ve seen project managers shorten things on charts to “fit things in” without checking with the teams. Re-estimating other peoples forecasts is dangerous. How do you tell the forecast has been agreed? You can’t.
I’ve seen project managers move work items from one team to another without re-forecasting - including on work that has already started. One team's forecast does not equate to the way another team would solve it. How do you tell the forecast has been agreed? You can’t.
I’ve seen project managers move things in a gantt chart without taking into account team member holidays, Christmas breaks, pandemic activities. An estimate may have been made with these factors in mind, but in the hands of an overzealous planner how do you tell it’s been accepted? You can’t.
All these behaviours are unforgivable, yet we feel like productivity gurus when we move the boxes on the chart simply because it feels like action. In reality we’ve alienated teams, caused stress and tension and spread mistrust. (But these things come later, and the people left holding the blame are normally the teams that failed to deliver, not the managers who had the best intentions).
They act as if we’re still in a Taylorist world where people are just resources that can be placed into a schedule as if they are robots. Ironically, this would have been against the concepts devised by the original creator Henry Gantt. In 1910 he said:
"The general policy of the past has been to drive; but the era of force must give way to the era of knowledge, and the policy of the future will be to teach and lead, to the advantage of all concerned."
This is a man who had ideas about the psychology of happy workplaces way before Dan Pink told us about the motivations of an individual. He would be dismayed to see how his tool has been misused in today’s knowledge work.
What should we use instead?
Hopefully I’ve convinced you that Gantt Charts are bad. However it doesn’t escape the fundamental question on any project sponsor’s lips “How much is this going to cost me?”. And the answer is never simple. The answer is “It depends”.
If we’re not going to use Gantt charts, what should we use instead? Well, there are a few options, and it really depends on what you need to bring to the fore in the way you plan.
Burnup
You only get an understanding of how much work there is after you start to actually do the work. To deal with this, Agile teams use a visualisation called a burnup.
In a burnup, the tasks are comparatively sized against each other.As we make progress towards delivering the work required we ‘burn’ everything we’ve completed. As we discover more work, we add it. This can be visualised thanks to a dynamic graph that will shift over time, but what’s important is that a pattern will start to form. This is good news - humans are usually very good at pattern detection. This means teams will gradually be able to better predict the future and accurately forecast deliveries.
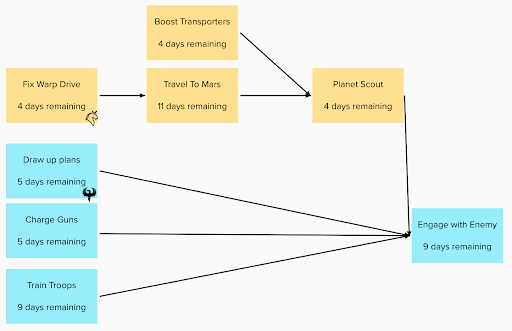
A network diagram for dependencies
Gantt charts do try to show dependencies for specific work items. This is important of course, but it’s not that useful to visualise these across a calendar..
Instead, it’s far more effective to use a simple network diagram that shows how different work items connect with one another. If we annotate such a diagram with forecasts then we can estimate the days until everything is complete. We can also do critical path analysis - which is finding the sequence of work items that will take the longest amount of time - helping stakeholders figure out the ultimate answer “When will this be done?”
Knowing the critical path to delivery helps us focus efforts on finding alternative approaches on the critical path - things that might expedite the overall timeline rather than trying to fix things that will feel productive but have no bearing on the final delivery date.
Tools aren’t everything
While these tools are useful, for teams and organisations that swear by Gantt charts, there’s typically a more fundamental flaw: long-running projects with infrequent deliveries.
A company that has teams that release real value every 2 weeks or sooner is not going to invest the cognitive load into delicately balancing their resources against the shortest possible path to get all the features delivered by a given date. Instead they will aggressively identify the next most important small release and ruthlessly push anything slowing down the delivery of that next increment.
This is where an Agile mindset is particularly beneficial. It won’t help you use Gantt charts more effectively - it should, in theory, make them completely unnecessary. That’s a world I want to see - the next question is, do you?
Talk to us about ditching your Gantt charts. Get in touch.